Chimaera Todd
Cartography, GIS and remote sensing. Selected work, 2025–2026.
| Based in | Richmond, Virginia |
|---|---|
| Education | B.S. Geography, James Madison University, 2026 |
| Focus | Geospatial analysis, image processing, cartographic design |
| Software | ArcGIS Pro, PCI Geomatica, R |
| toddcw04@gmail.com |
Chimaera Todd is a geographer and a 2026 graduate of James Madison University, where she earned a B.S. in Geography magna cum laude. She completed concentrations in Applied Geographic Information Science and in Environmental Conservation, Sustainability & Development, along with a minor in History.
This portfolio collects her coursework and team projects from 2025 and 2026. It includes an impervious surface assessment prepared for the City of Winchester, a fire risk assessment for two Virginia counties, a report proposing four federal programs for Appalachia, and four designed maps.
Selected work
Impervious surface assessment, Winchester, Virginia
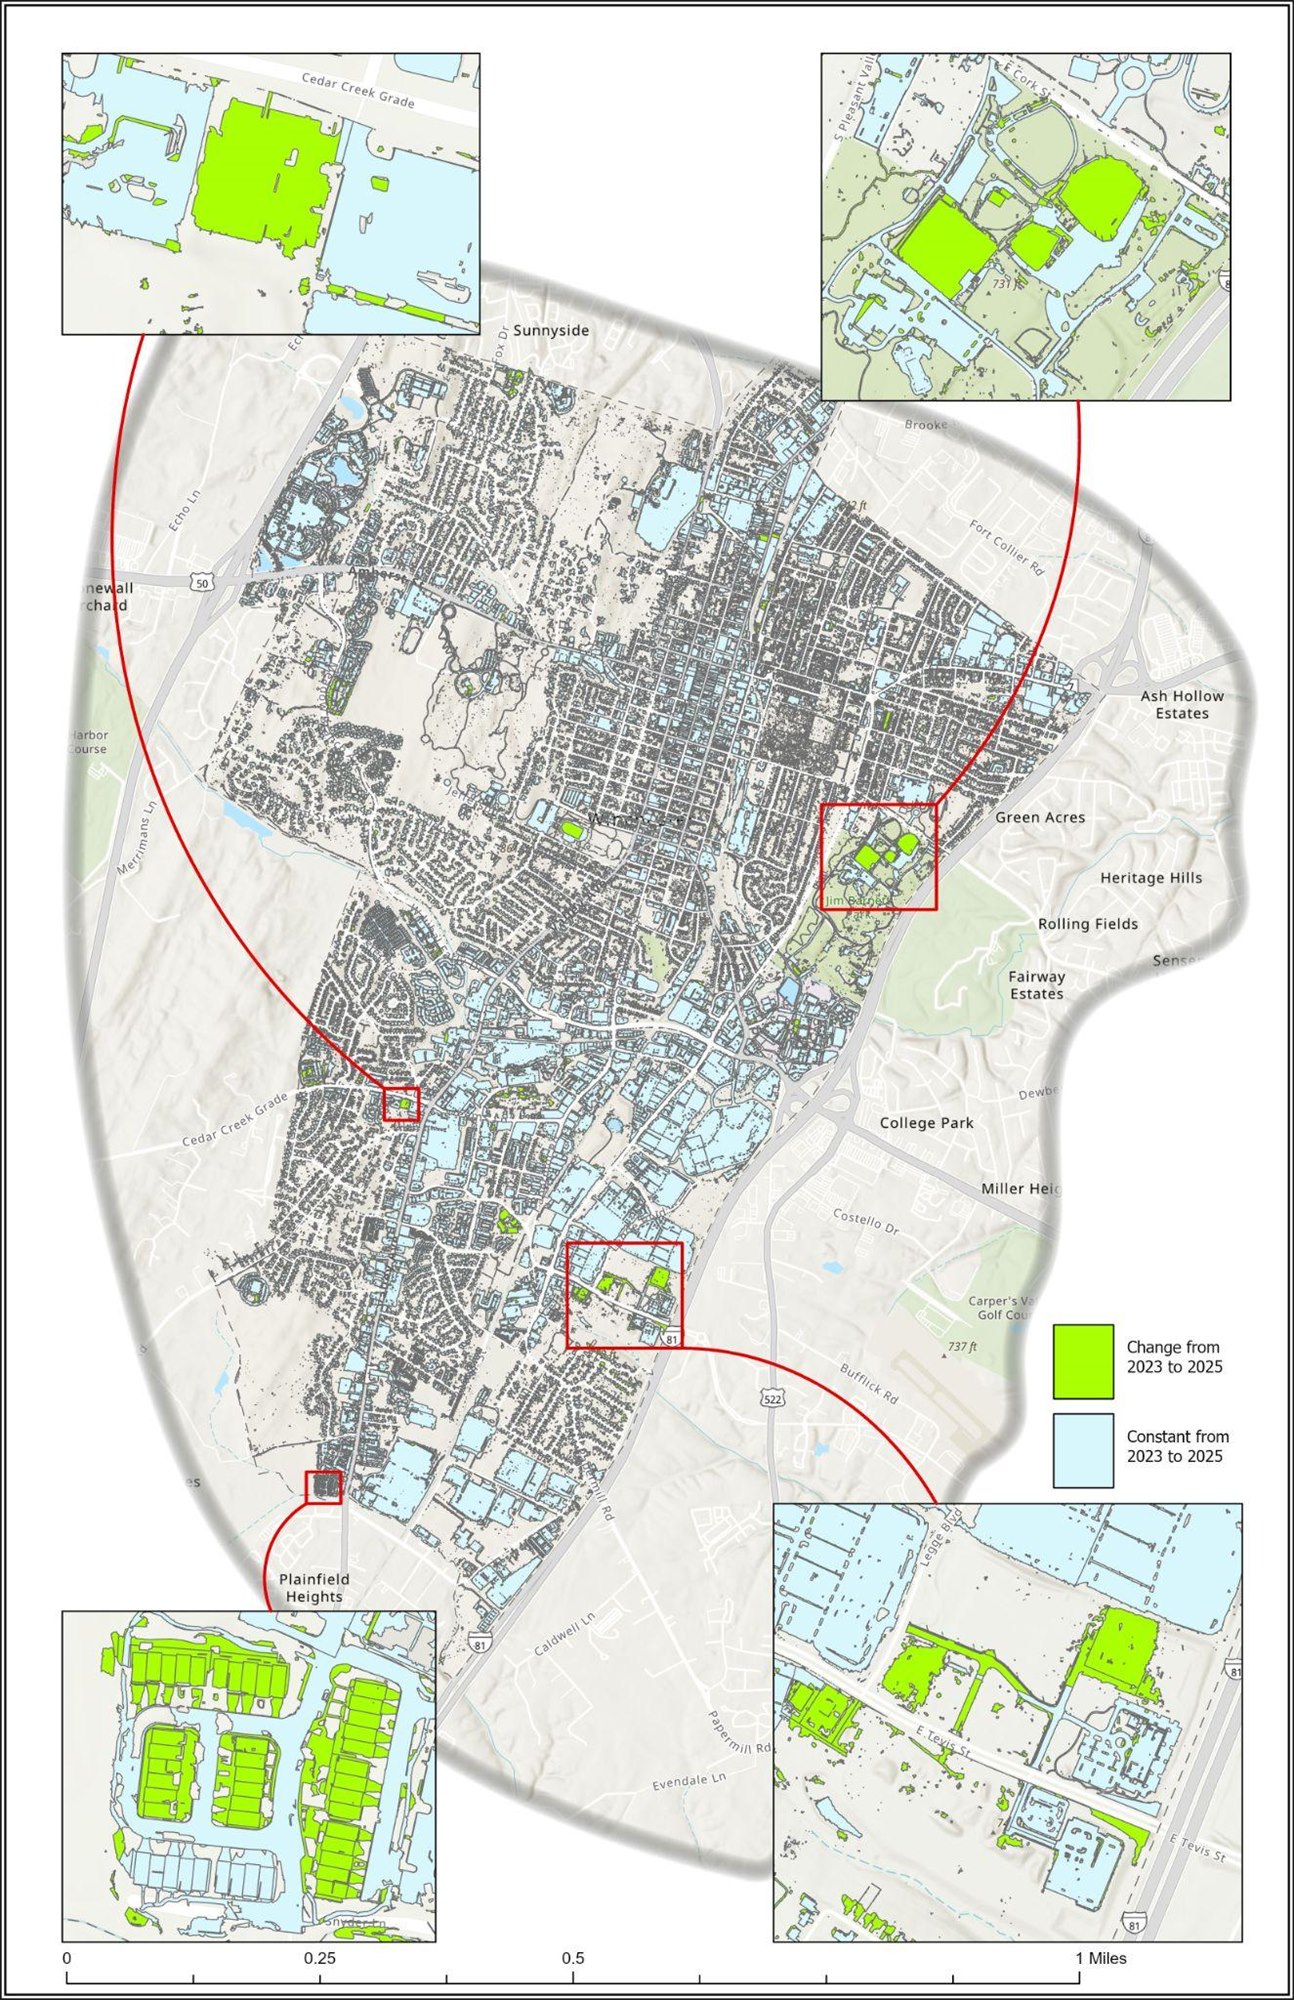
This team project assessed impervious surfaces in the City of Winchester to support billing under the city's new stormwater fee. The fee was calculated for each parcel using the city's proposed rate of $0.22 per 50 square feet of impervious area. The team compared 2025 EagleView aerial imagery with 2023 imagery to find changes in impervious areas such as roads, rooftops, driveways, parking lots and turf athletic fields.
The 2025 imagery was combined in ArcGIS Pro into three rasters of 21 to 22 tiles each, so the team could work on them at the same time and the computers could handle the data. The rasters were segmented in PCI Geomatica using a scale of 25, rectangularity of 0.5 and compactness of 0.5, values chosen to slightly oversegment the image. The team collected training data for impervious and pervious classes, gathering more than 60,000 segments per class across different types of terrain and land use. Classification used segment attributes including mean, maximum, minimum, standard deviation, perimeter, area, compactness, rectangularity and NDVI. After the first classification, more training data was added by hand and the classification was run again. Features that were often misclassified included trailers, water features, construction sites, brick structures and concrete paths.
The classified rasters were merged, dissolved into continuous impervious and pervious areas, and clipped to the city's parcel boundaries. Impervious area was then summed for each parcel and converted into billing units and a fee. The total across all parcels came to $442,142.14, which does not include railroads because they were not within the parcel boundaries.
An accuracy assessment using 149 reference points gave an overall accuracy of 97.99% and a kappa statistic of 0.957. The report notes that the 100% results for two of the class accuracy measures are likely due to the limited sample size, and that more reference points would probably reveal additional minor errors. Most of the errors found were impervious features, such as dark roofs, driveways and paved paths, that were classified as pervious.
A change analysis made with the Erase tool in ArcGIS Pro found the largest increases in impervious surface in residential and commercial areas. The map insets highlight the Lofts at Creekside apartment complex, the Shoppes at Crossover shopping center, a new dental office and newly built turf baseball fields. The report reads this growth as a sign of population growth in the city.
| Prepared for | City of Winchester, Virginia |
|---|---|
| Date | 10 October 2025 |
| Team | Precision GIS: Nathan Blechl, Chimaera Todd, Zaina Olibah |
| Role | Image segmentation and classification in PCI Geomatica; collected training data and recollected it to correct classification errors |
| Recognition | The team received the Client's Choice, Accuracy and Budgeting awards |
| Software | ArcGIS Pro, PCI Geomatica |
| Data | EagleView Technologies aerial imagery, 2023 and 2025; City of Winchester parcel boundaries |
| Documents | Full report (DOCX) · Change analysis map (PDF) |
Valley and Ridge fire risk assessment
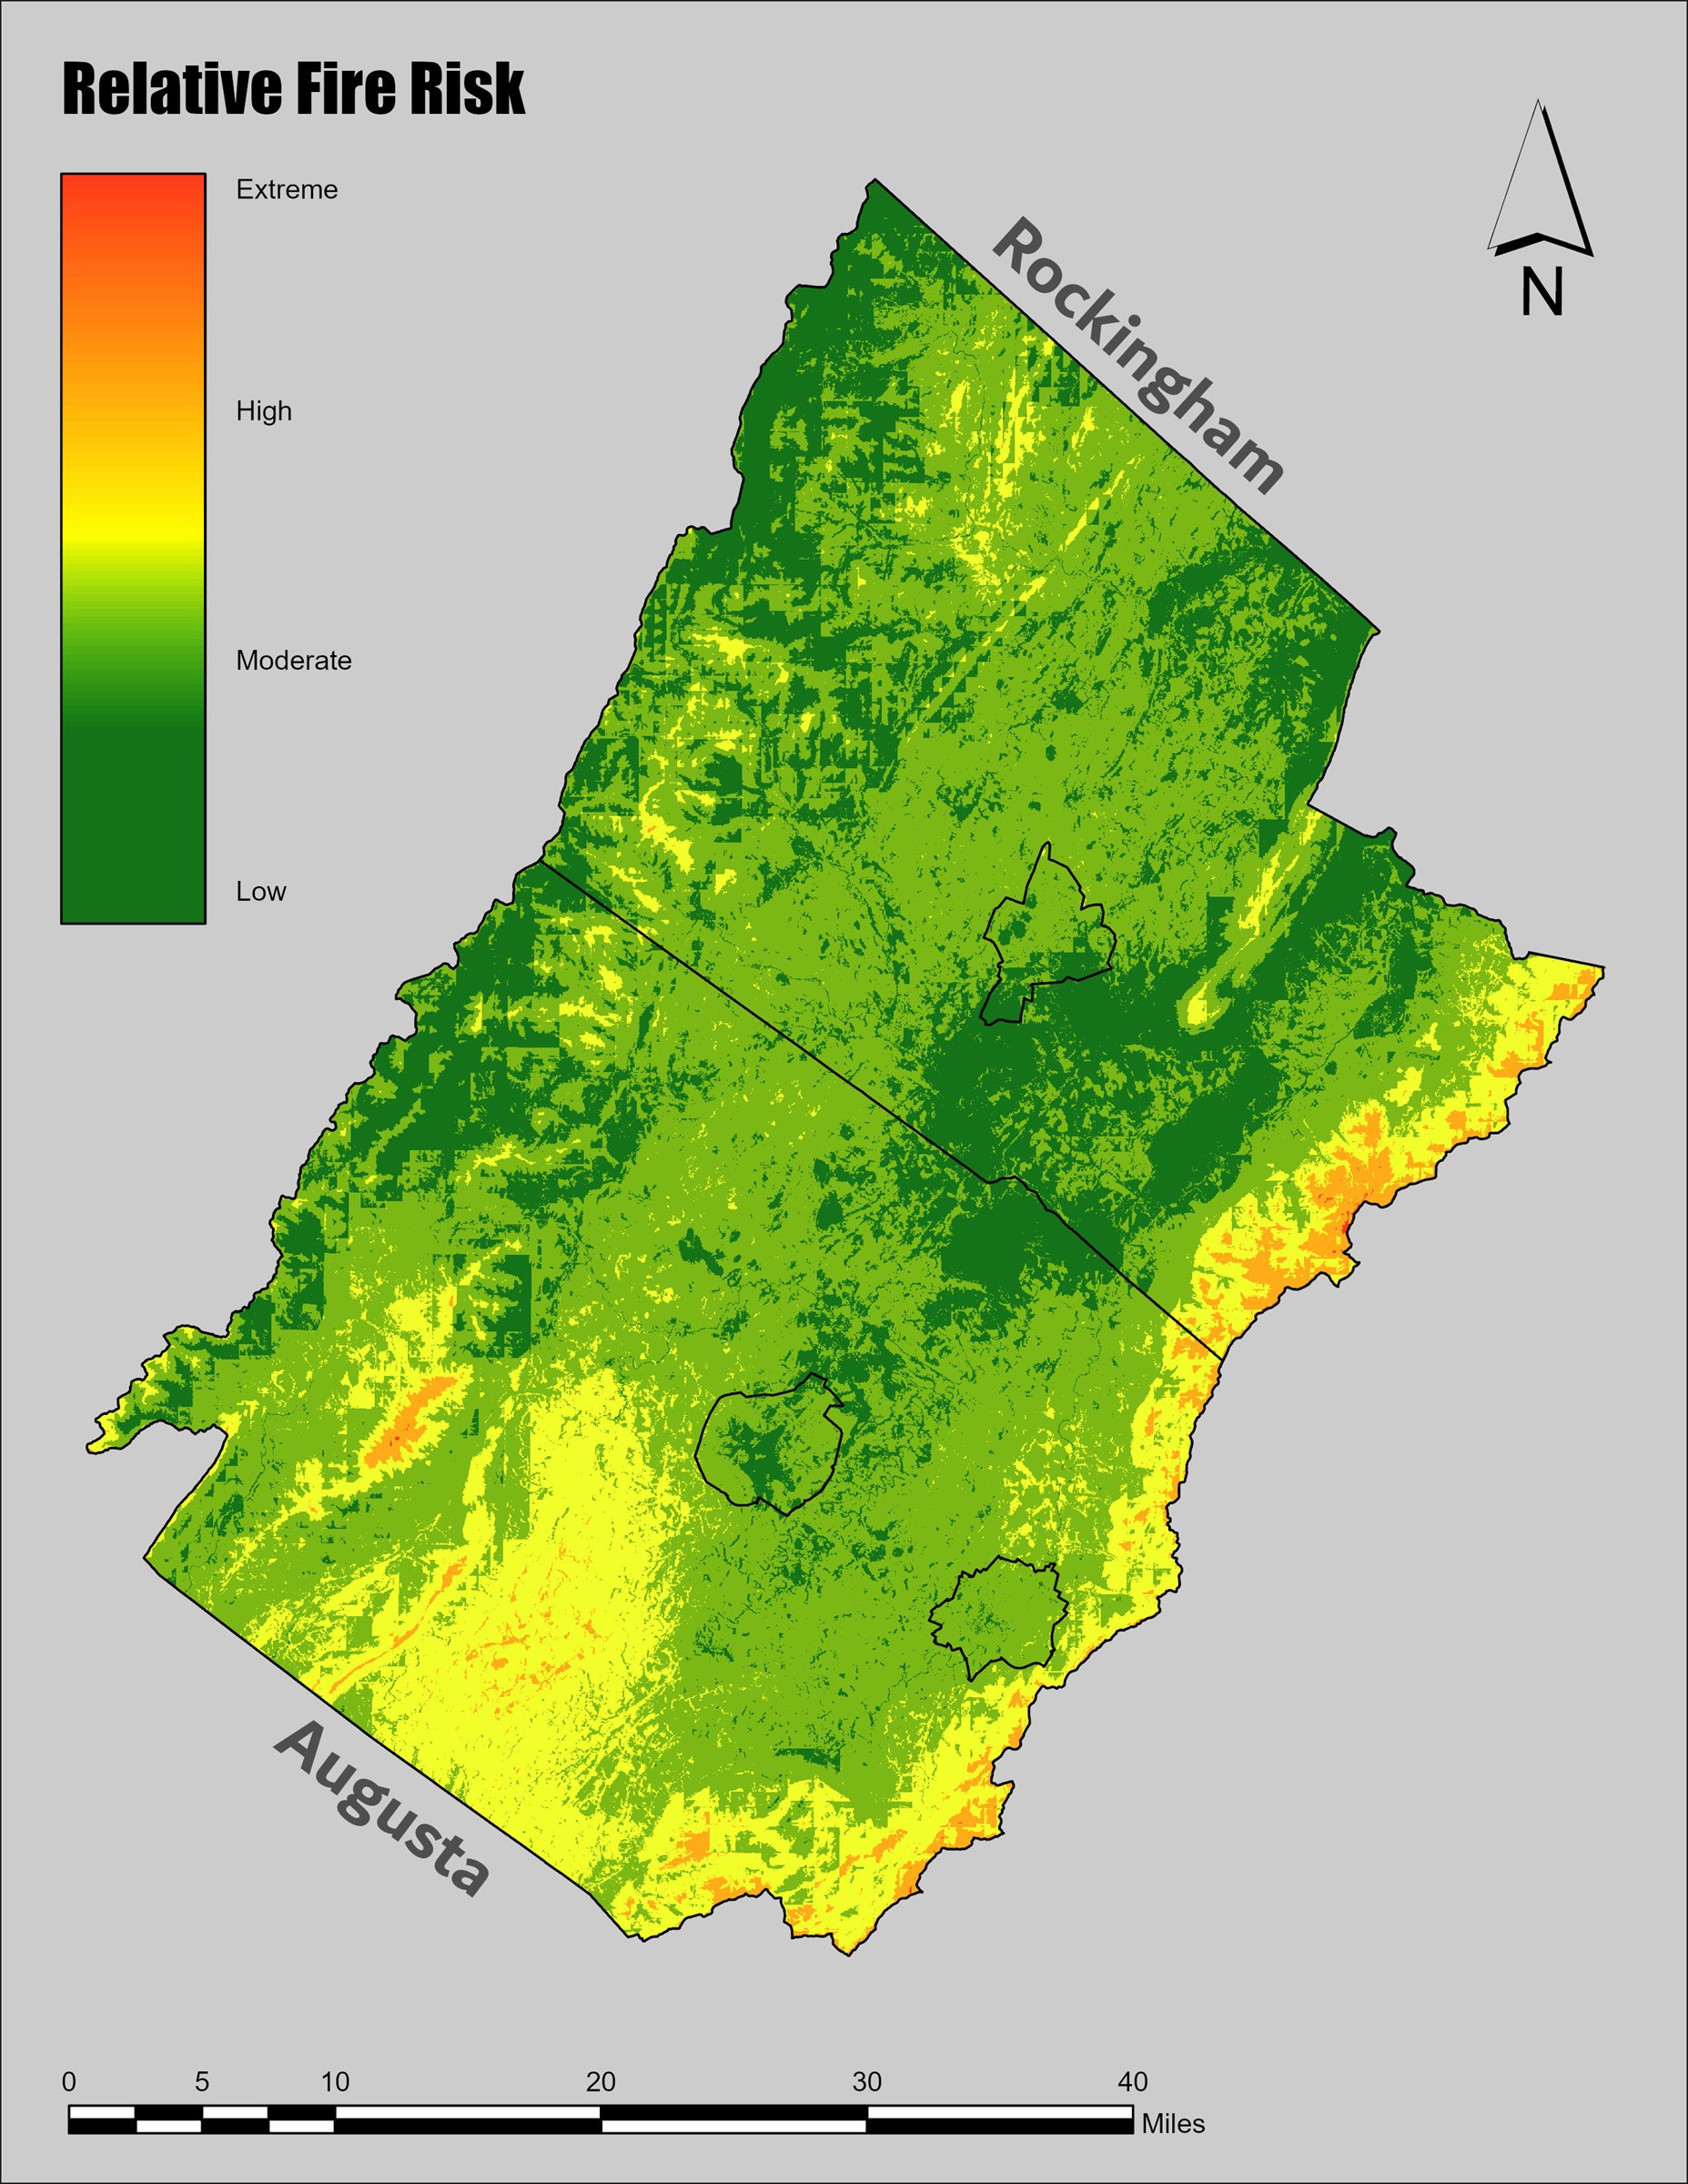
This team project set out to find which parts of Rockingham and Augusta counties in Virginia are at the highest risk of burning in a wildfire. The approach was to examine several types of data, work out which ones give the most accurate results, and combine them into a single risk layer.
The team's proposal described the method. Data for the Valley and Ridge region would be prepared in ArcGIS Pro, and random sample points would be placed in both burned and unburned forest. Predictor values would be extracted at those points, including NDVI, tasseled cap greenness and wetness, digital number values, texture, radar backscatter, climate data (precipitation, humidity and drought severity), topography (elevation, slope and aspect) and forest composition (species, canopy cover and age). Stepwise multiple linear regression in SPSS would show which predictors were most useful, and those equations would then be applied to the study area in ArcGIS Pro.
The proposal set a budget of $12,683.40 across three roles, with a final report due on 5 December 2025. The map shown here is the team's relative fire risk layer for the two counties.
| Study area | Rockingham and Augusta counties, Virginia |
|---|---|
| Team | Ultra Budget GIS Analysts: Chimaera Todd, Zachary Rosenburg, Jeffrey Gale |
| Course | GEOG 485, Advanced Topics in Remote Sensing (Grand Challenge II) |
| Prepared for | Dr. Jennifer Mangan and Dr. Kevin Varga |
| Proposed software | ArcGIS Pro, SPSS |
| Proposed data | Interagency fire perimeters; NDVI (NASA/USGS, ESA); forest composition (US Forest Service); temperature and precipitation (OSU); radar (ESA); elevation (USGS 3DEP); drought severity and wind speed (NOAA) |
| Document | Project proposal (DOCX) |
Lessons from the TVA: Creating Federal Programs in Appalachia
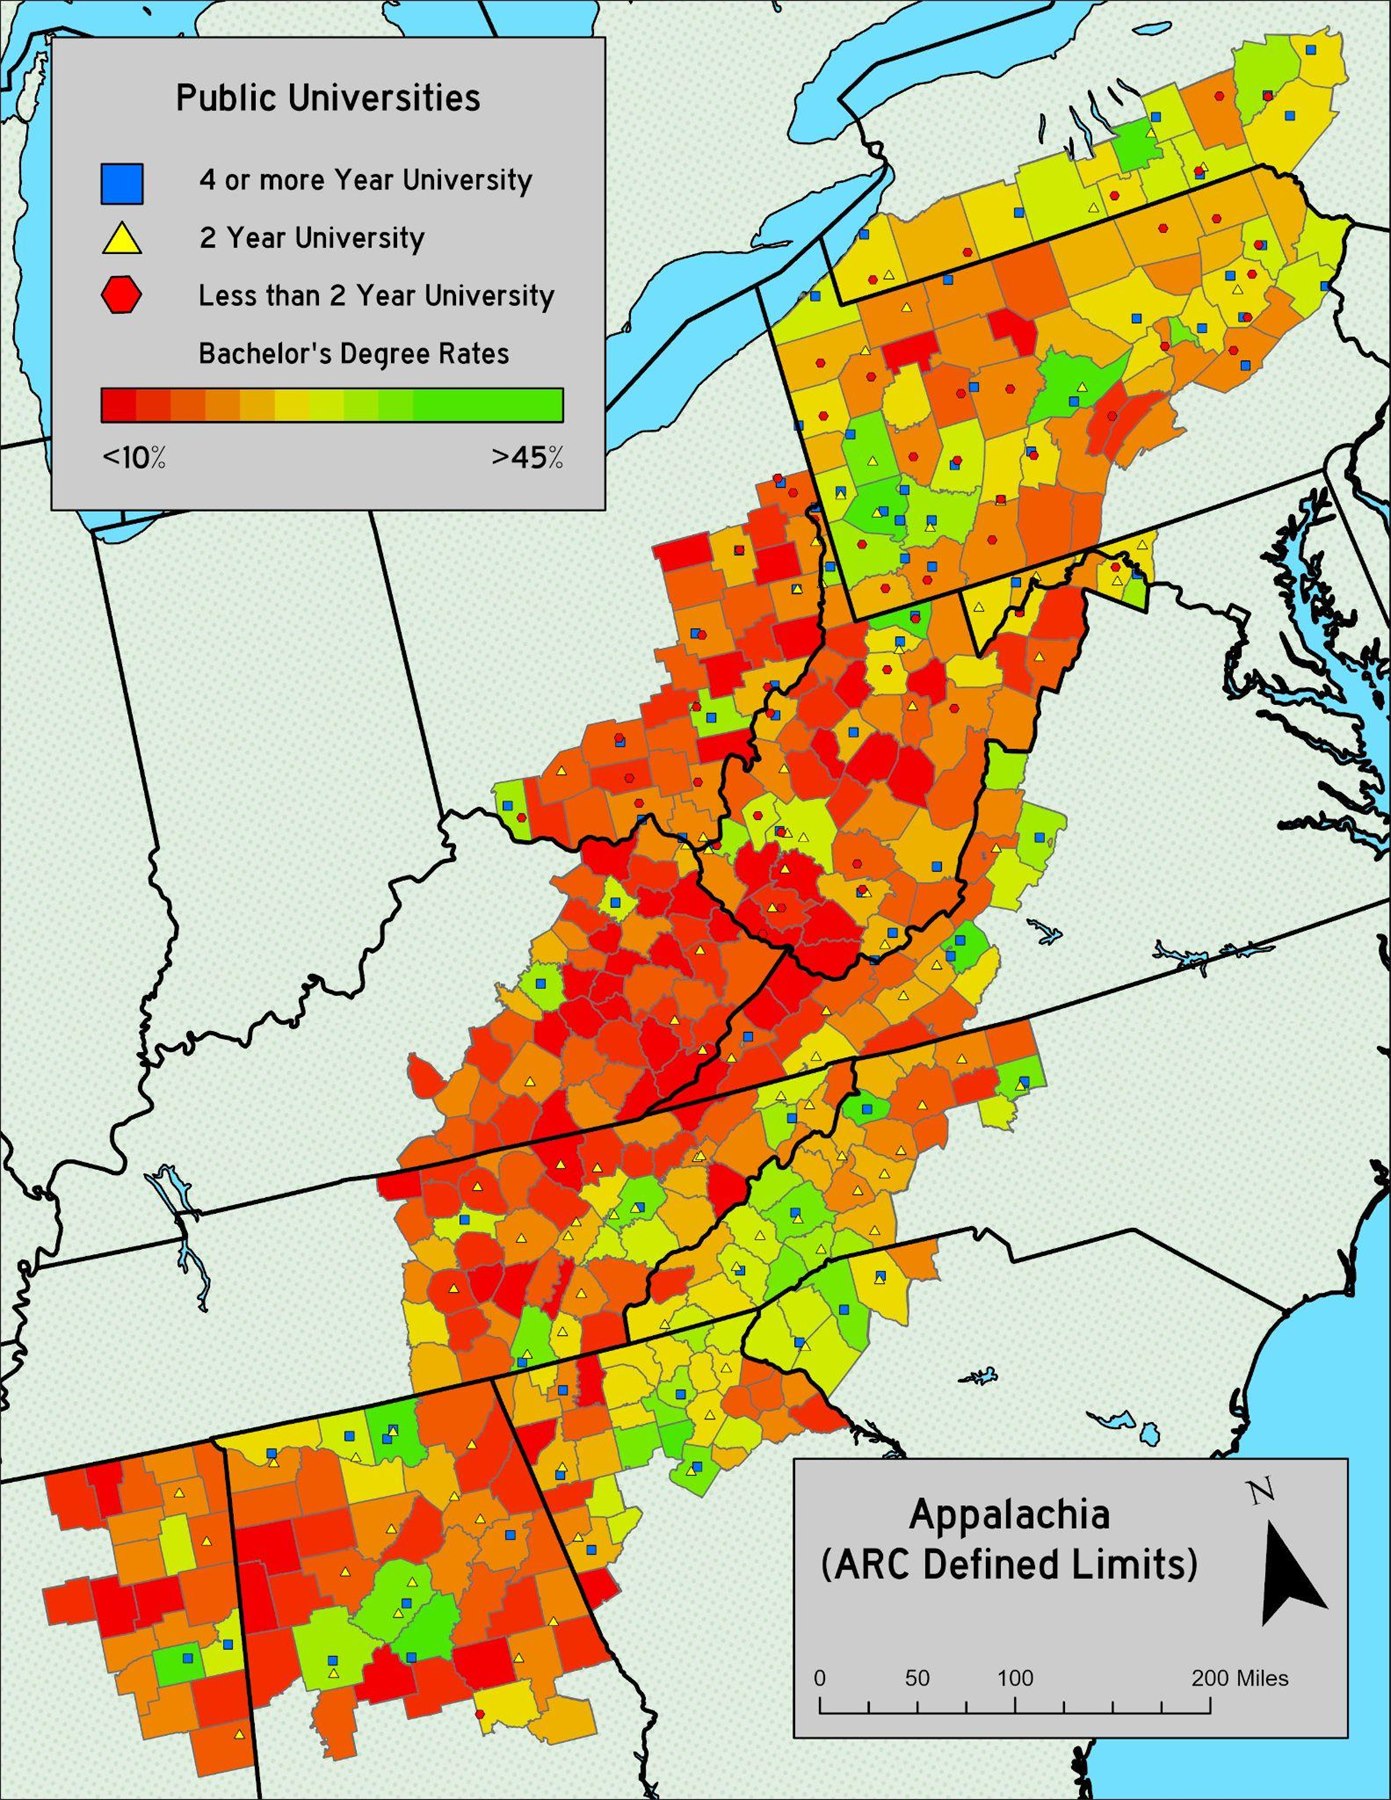
This report was the final project for GEOG 470, the senior seminar in Environmental Conservation, Sustainability & Development. It starts with the Tennessee Valley Authority, created in 1933 to address flooding in the Tennessee River valley, which the report describes as arguably the largest single driver of socioeconomic development in southern Appalachia. The report notes that the region still faces problems such as poverty, limited education and poor access to healthcare, and asks whether new federal programs modeled on the New Deal could help address them.
The report proposes four theoretical bills, each creating a federal program for one issue: healthcare, higher education, public transportation and tourism. Each bill uses mapped data to show where investment is needed across the 423 counties in 13 states that the Appalachian Regional Commission defines as Appalachia.
- Appalachian Healthcare Commission (AHC). Healthcare facility locations from OpenStreetMap were aggregated by county in ArcGIS Pro and compared with HRSA medically underserved areas. Counties that lack healthcare facilities and are also medically underserved were chosen as targets for new facilities. Many of these counties are in central Appalachia.
- Appalachian University and Trade Education Coalition (AUTEC). Possible satellite campus locations were found in two ways. The first selected counties with more than 100 residents per square mile and bachelor's degree attainment below 20%. Because that approach missed more rural areas, the second selected counties at least 15 miles from the nearest county with a four year public university. A separate analysis found counties with at least 75 residents per square mile and no existing trade or technical school.
- Regional Appalachian Public Transit System (RAPTS). Only 119 of the 423 counties are served by intercity bus routes, and the maps show much less service south of the Mason–Dixon line than north of it. Phase 1 of the program would add bus terminals in unserved cities along existing routes, and new routes to all unserved major cities and most unserved minor cities.
- Unified Board of Outdoor Appalachian Tourism (UBOAT). Areas with slopes between 25 and 50 degrees were mapped on federally owned land to find possible ski resort sites. Areas south of Tennessee's southern border were left out because of high temperatures. Six areas of interest were chosen: three in eastern Tennessee, one on the West Virginia and Virginia border, and two in western North Carolina.
The eleven maps from the report:
| Course | GEOG 470, Senior Seminar in Environmental Conservation, Sustainability & Development |
|---|---|
| Author | Chimaera Todd |
| Software | ArcGIS Pro |
| Data | HRSA medically underserved areas; OpenStreetMap healthcare facilities; US Census Bureau education, population and income; USGS education institutions, cities, basemap features, transportation and elevation |
| Document | Full report (DOCX) |
Baltimore and Ohio's Great Allegheny Passage
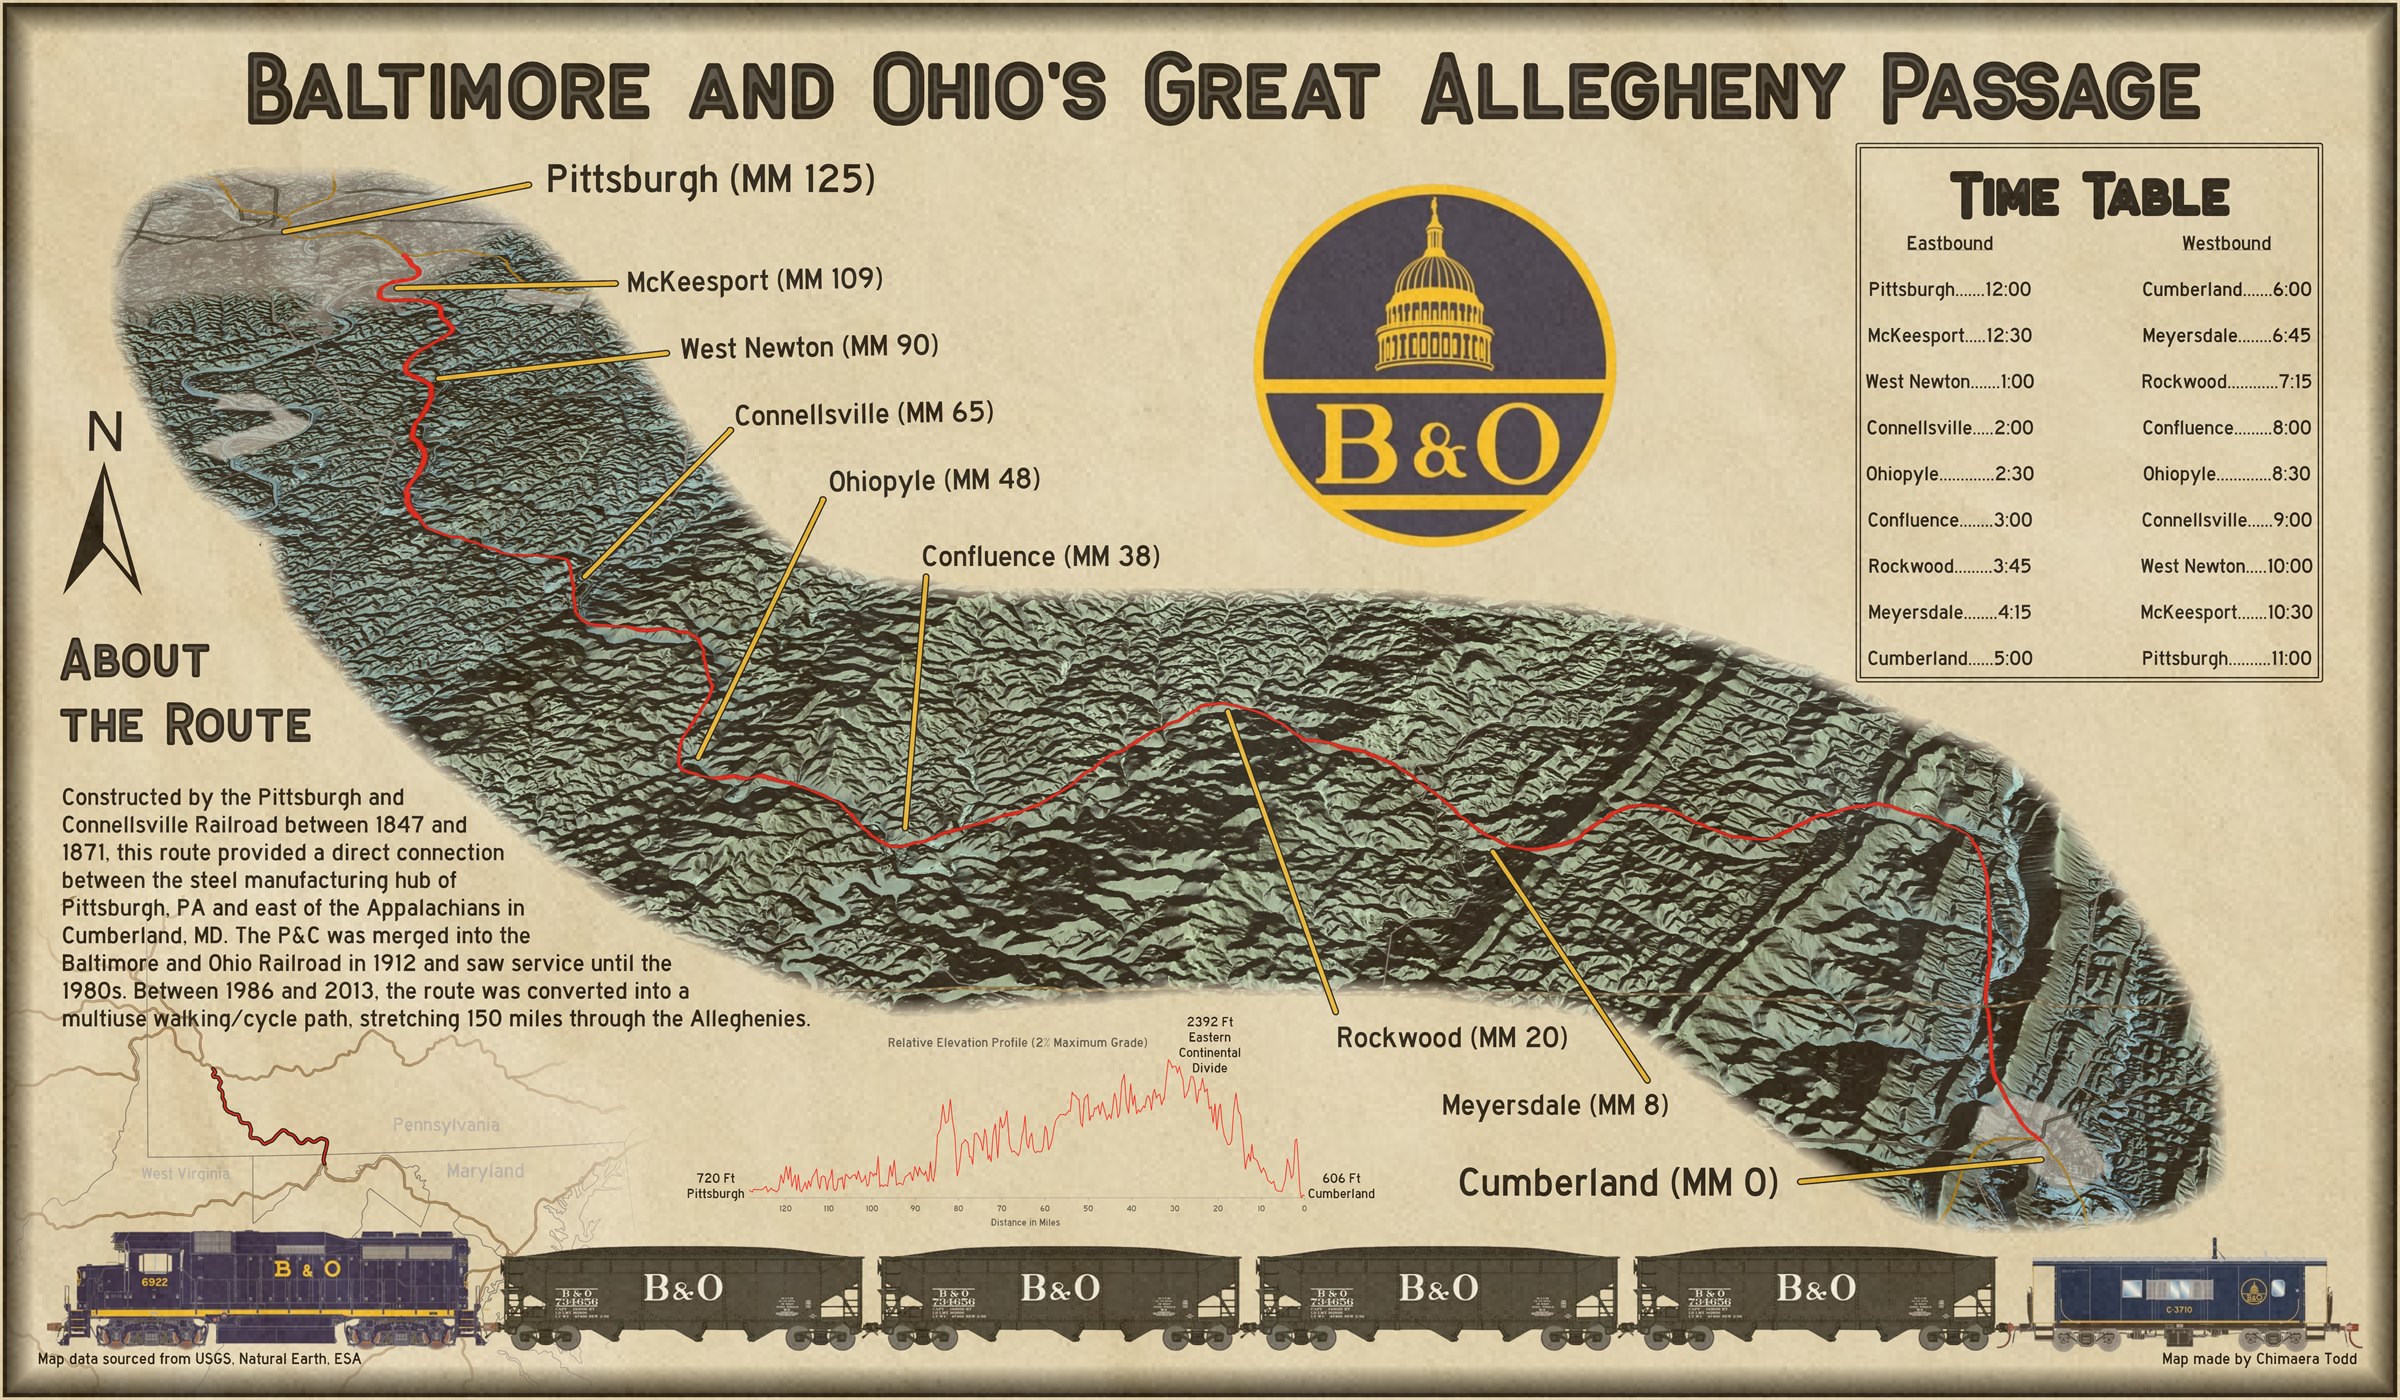
A map of the Great Allegheny Passage between Pittsburgh, Pennsylvania and Cumberland, Maryland. The map's "About the Route" panel explains that the line was built by the Pittsburgh and Connellsville Railroad between 1847 and 1871, merged into the Baltimore and Ohio Railroad in 1912, and used until the 1980s. Between 1986 and 2013 it was converted into a 150 mile walking and cycling path.
The route is drawn in red over shaded terrain, with stops labeled by mile marker. The map also includes a Baltimore and Ohio logo, an eastbound and westbound timetable, a locator map, and an elevation profile that rises from 720 feet at Pittsburgh to 2,392 feet at the Eastern Continental Divide and falls to 606 feet at Cumberland. A locomotive, hopper cars and a caboose run along the bottom of the layout.
| Subject | Pittsburgh, Pennsylvania to Cumberland, Maryland |
|---|---|
| Made by | Chimaera Todd, Fall 2025 |
| Data | USGS, Natural Earth, ESA |
Range of the American Chestnut in Southern Appalachia
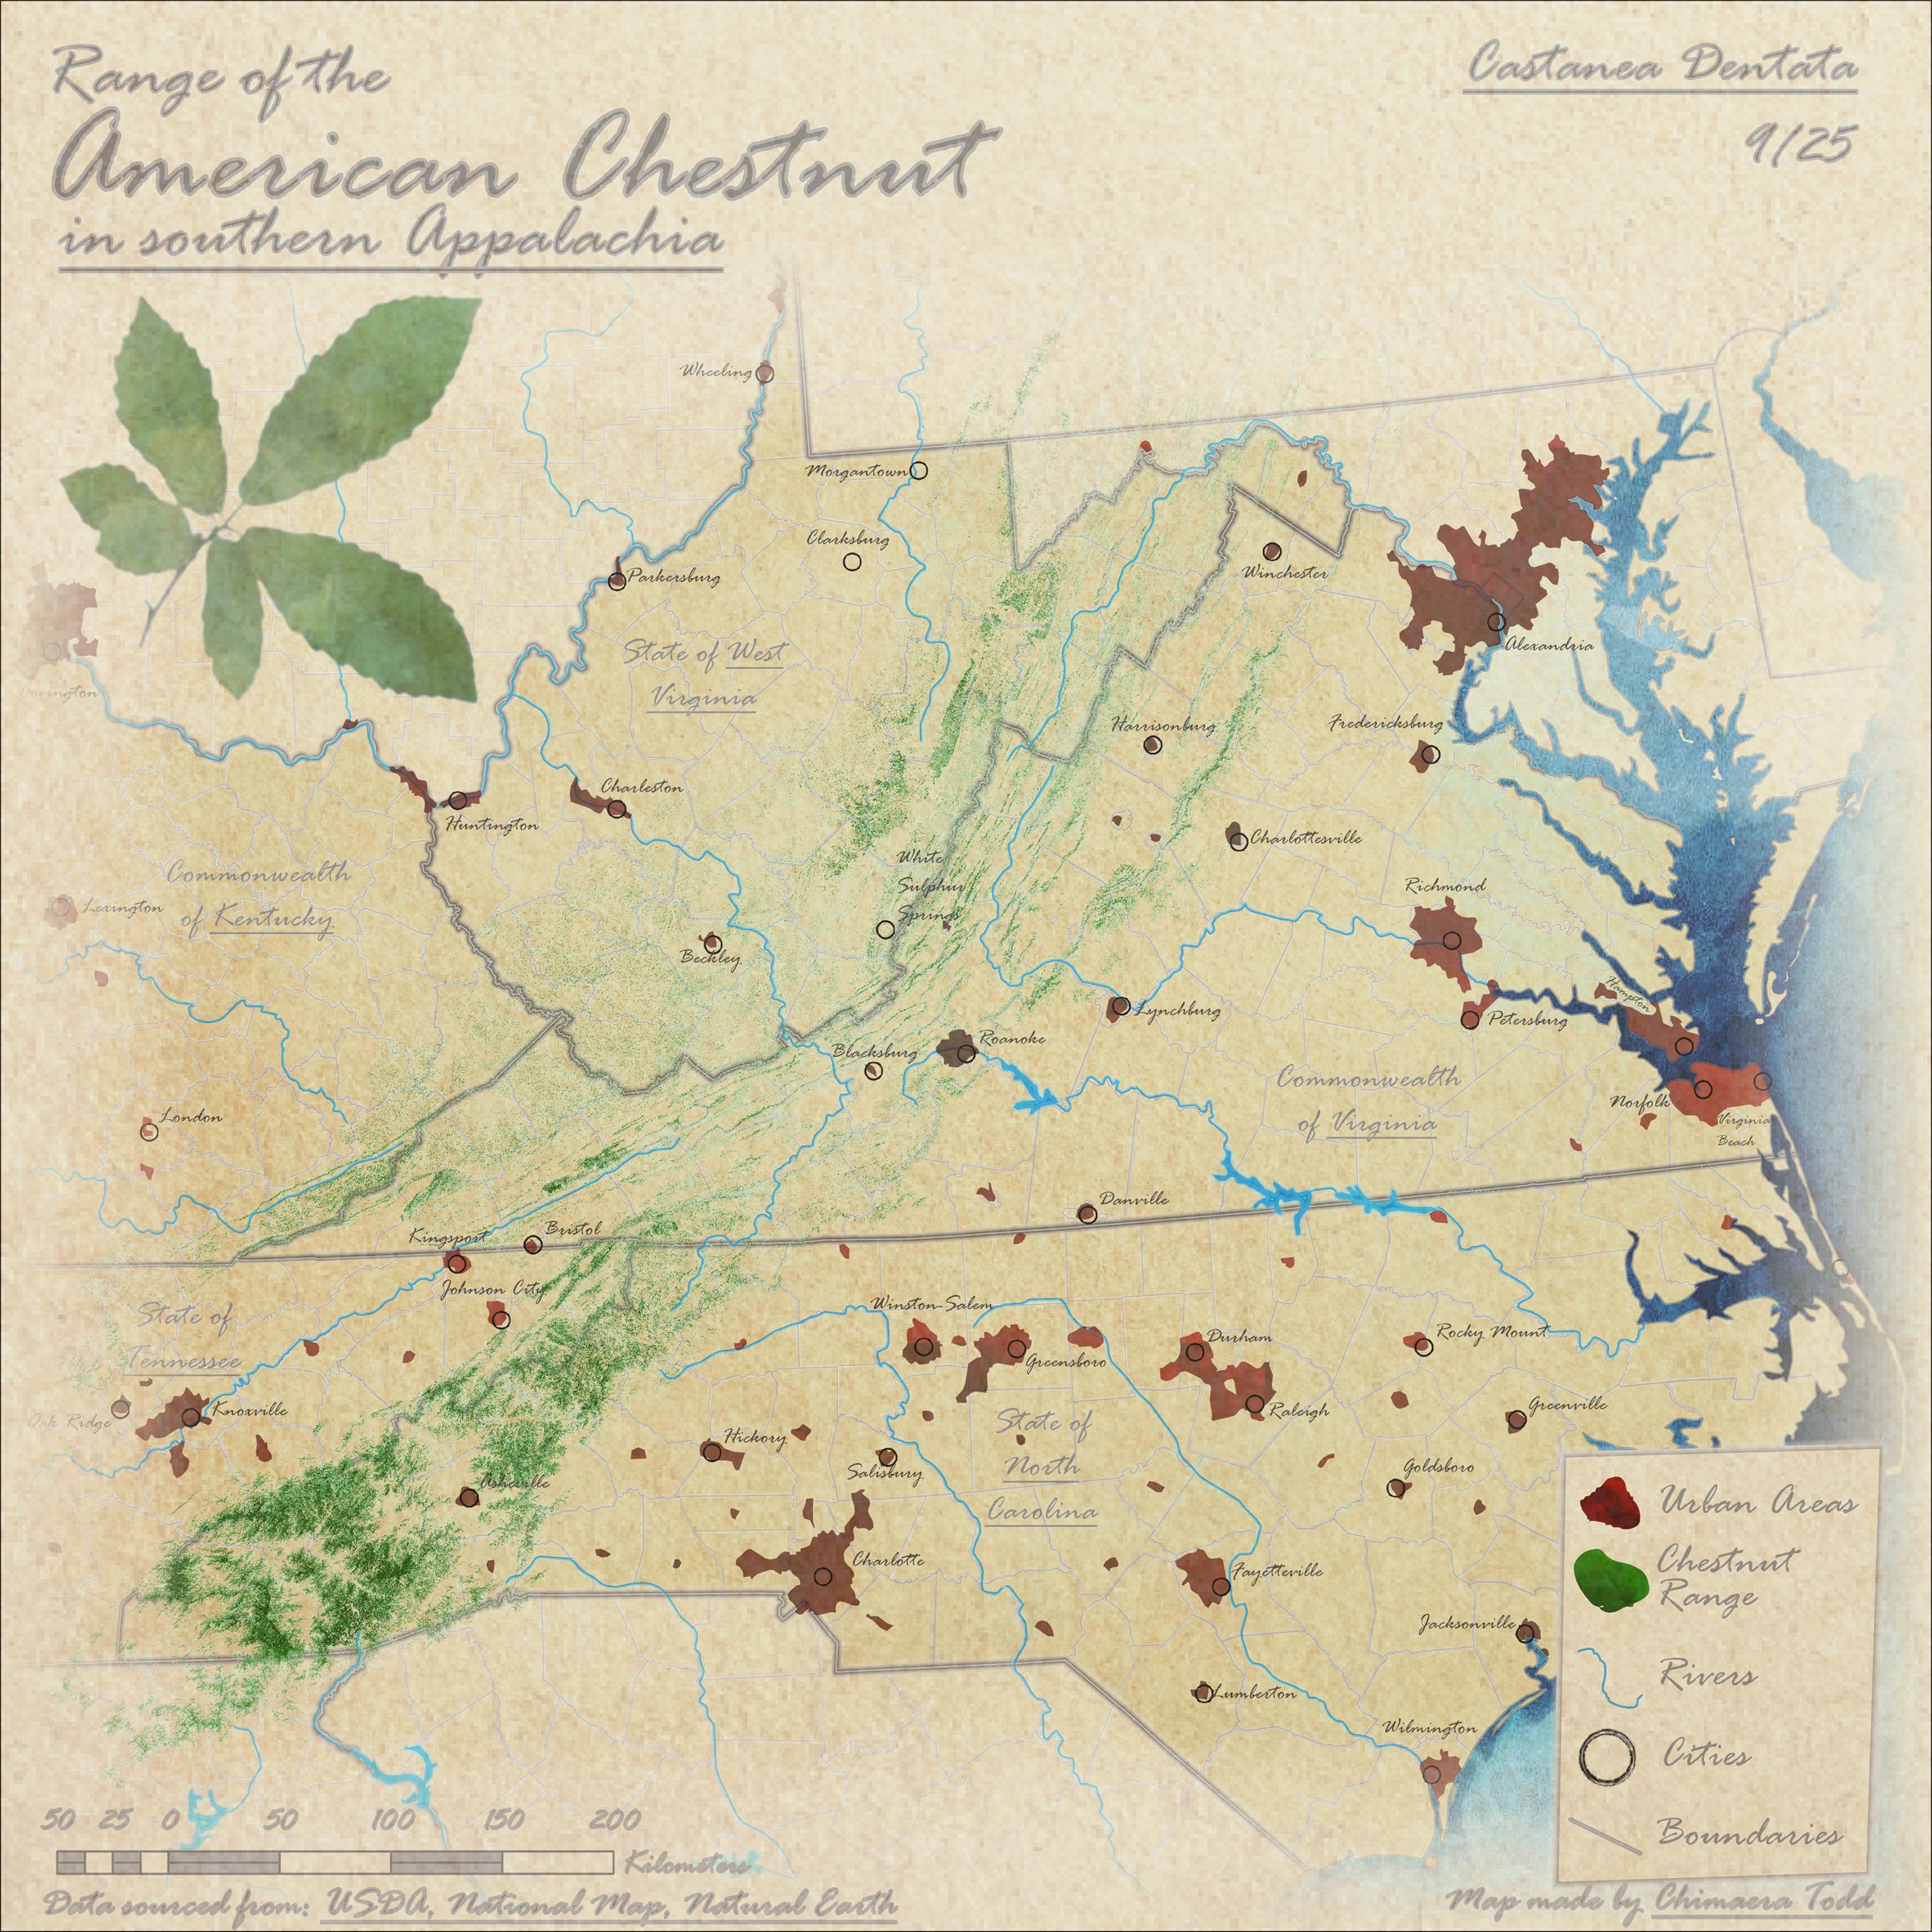
A map of the range of the American chestnut (Castanea dentata) in southern Appalachia, dated September 2025. It covers West Virginia, Virginia and North Carolina, along with parts of Kentucky and Tennessee. The chestnut range is shown in green along the Appalachian mountains, together with urban areas, cities, rivers and state and county boundaries.
The map is styled to look aged, with a paper textured background, script lettering and a chestnut leaf illustration in the upper left corner.
| Subject | Castanea dentata in southern Appalachia |
|---|---|
| Made by | Chimaera Todd, September 2025 |
| Data | USDA, The National Map, Natural Earth |
1937 Grand Prix Season: Championship Tracks
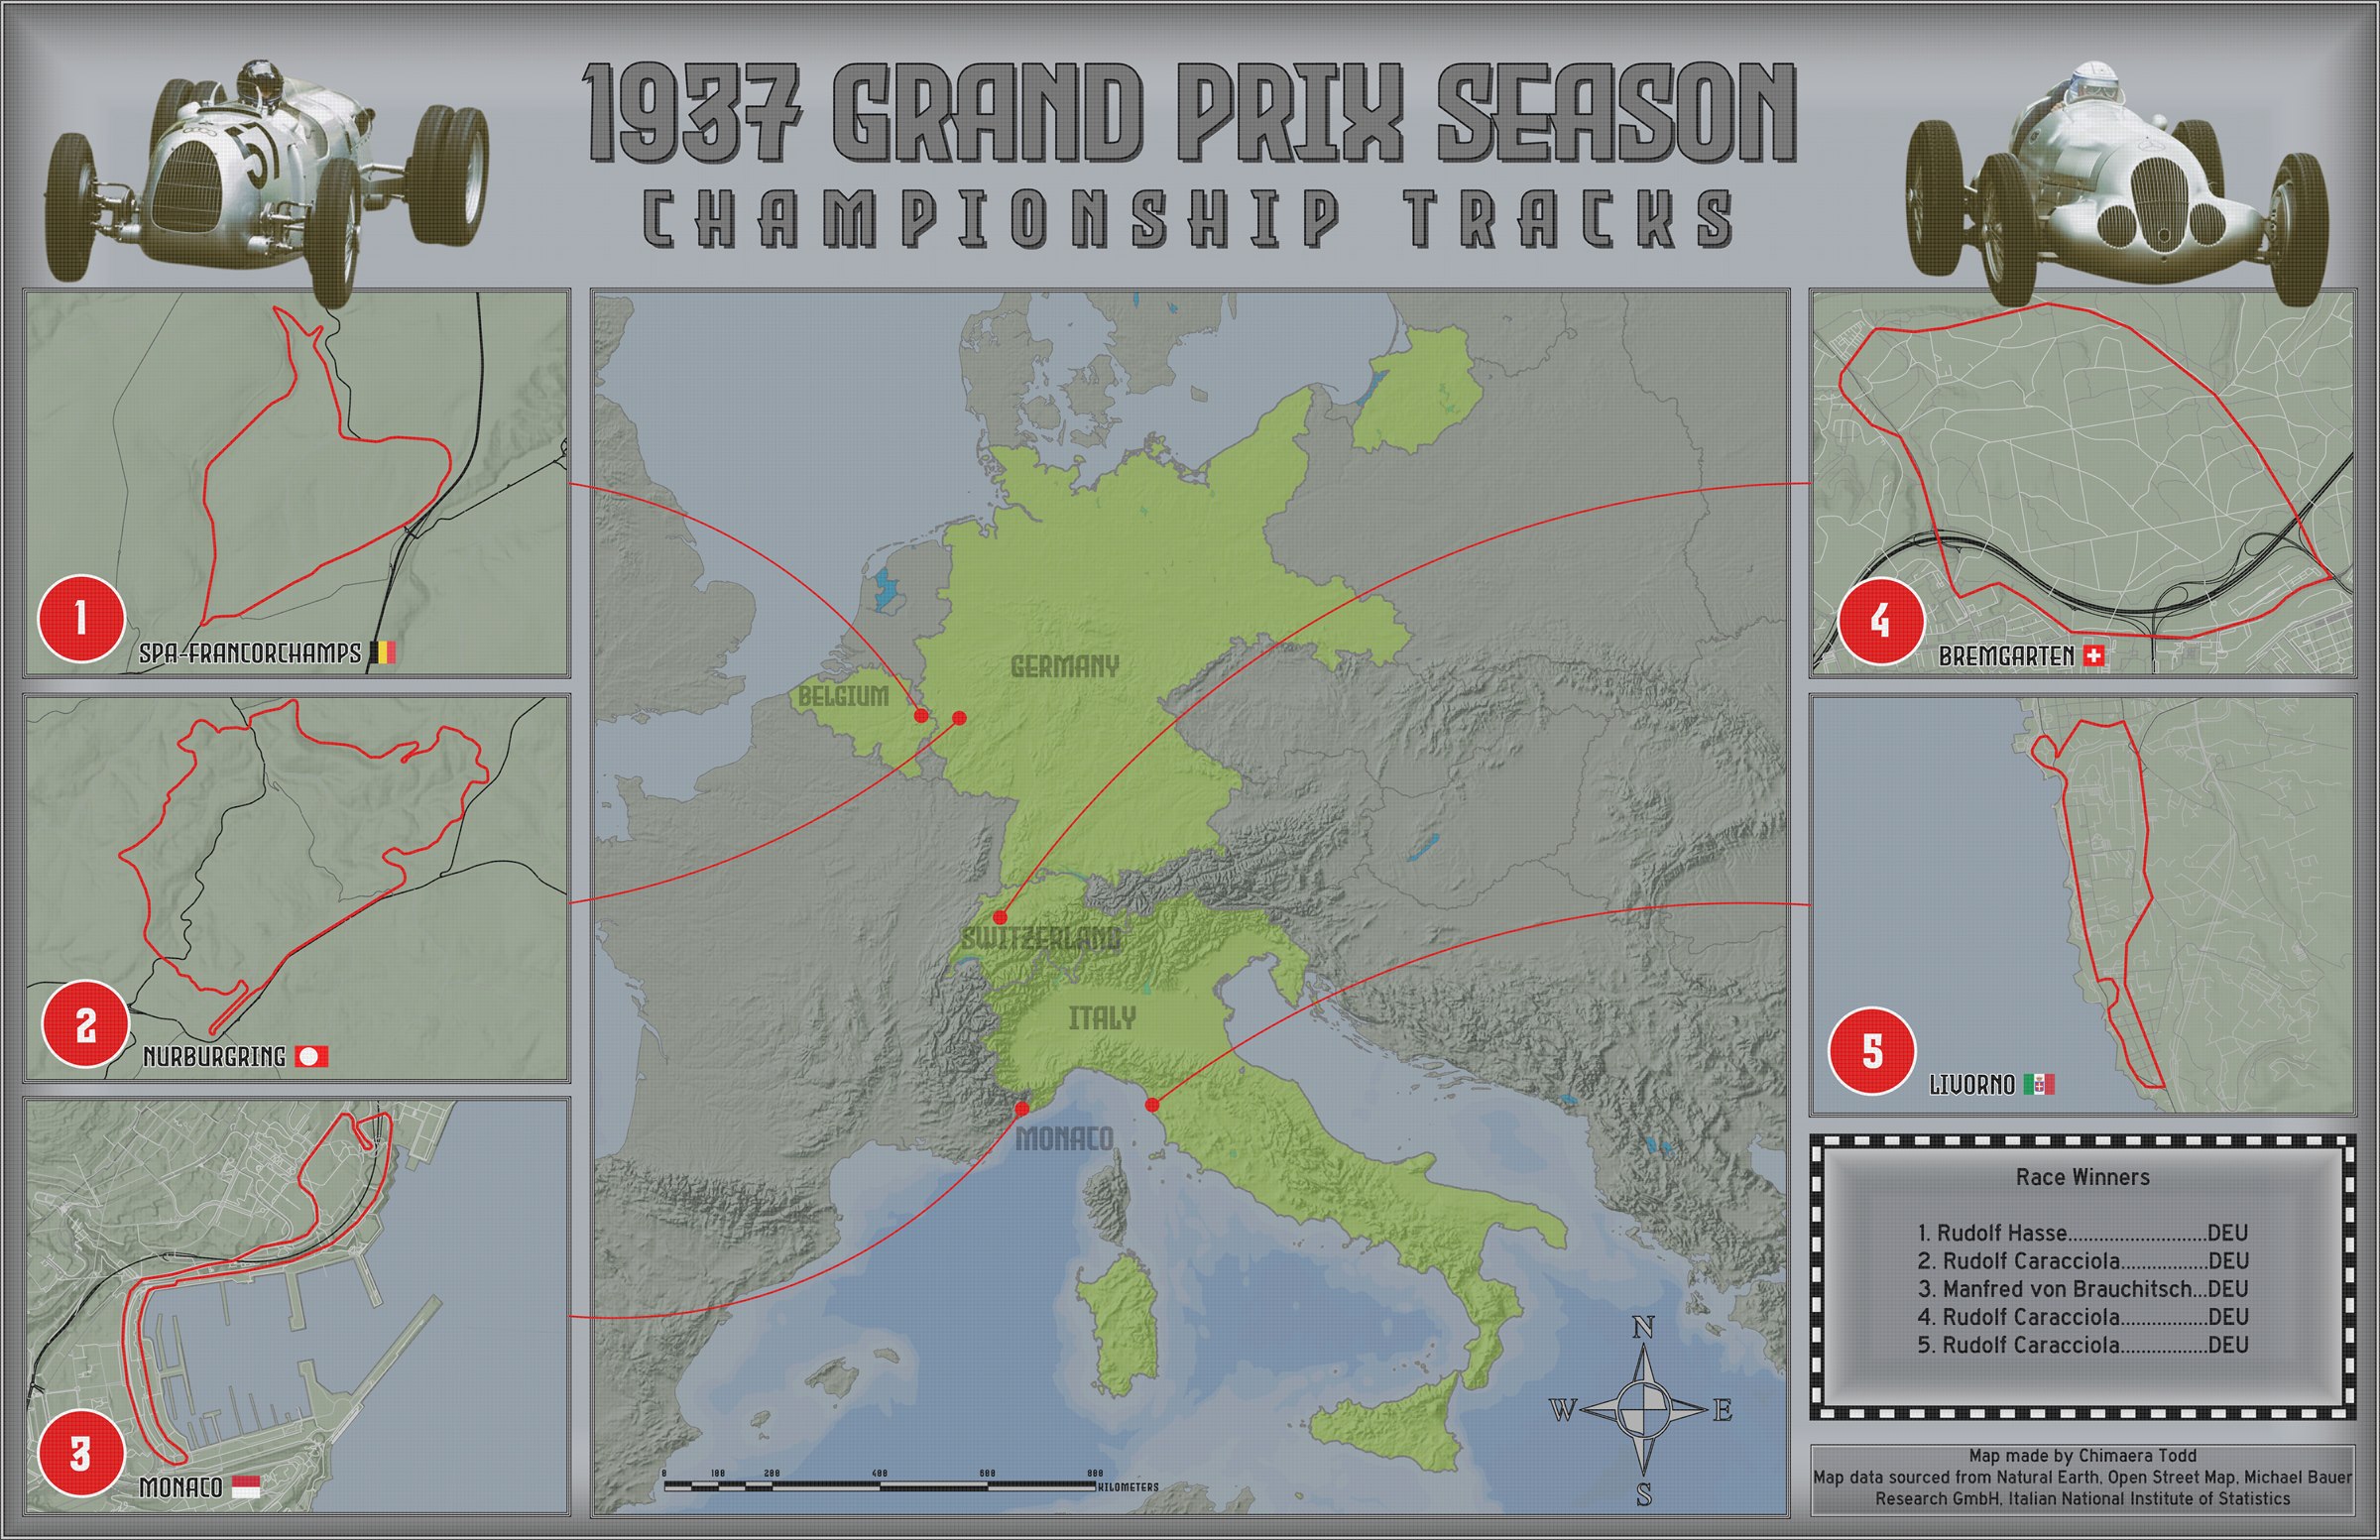
A map of the five championship tracks of the 1937 Grand Prix season: Spa-Francorchamps in Belgium, the Nürburgring in Germany, Monaco, Bremgarten in Switzerland and Livorno in Italy. A central map of Europe shows where each track is, and five inset maps show each circuit in red, connected to its location by a line.
A race winners panel lists Rudolf Hasse for round 1, Rudolf Caracciola for rounds 2, 4 and 5, and Manfred von Brauchitsch for round 3. The layout also includes illustrations of two race cars, a compass rose and a scale bar.
| Subject | Spa-Francorchamps, Nürburgring, Monaco, Bremgarten, Livorno |
|---|---|
| Made by | Chimaera Todd, Fall 2025 |
| Data | Natural Earth, OpenStreetMap, Michael Bauer Research GmbH, Italian National Institute of Statistics |
Recreation vs. Parking & Buildings in Mobile, AL
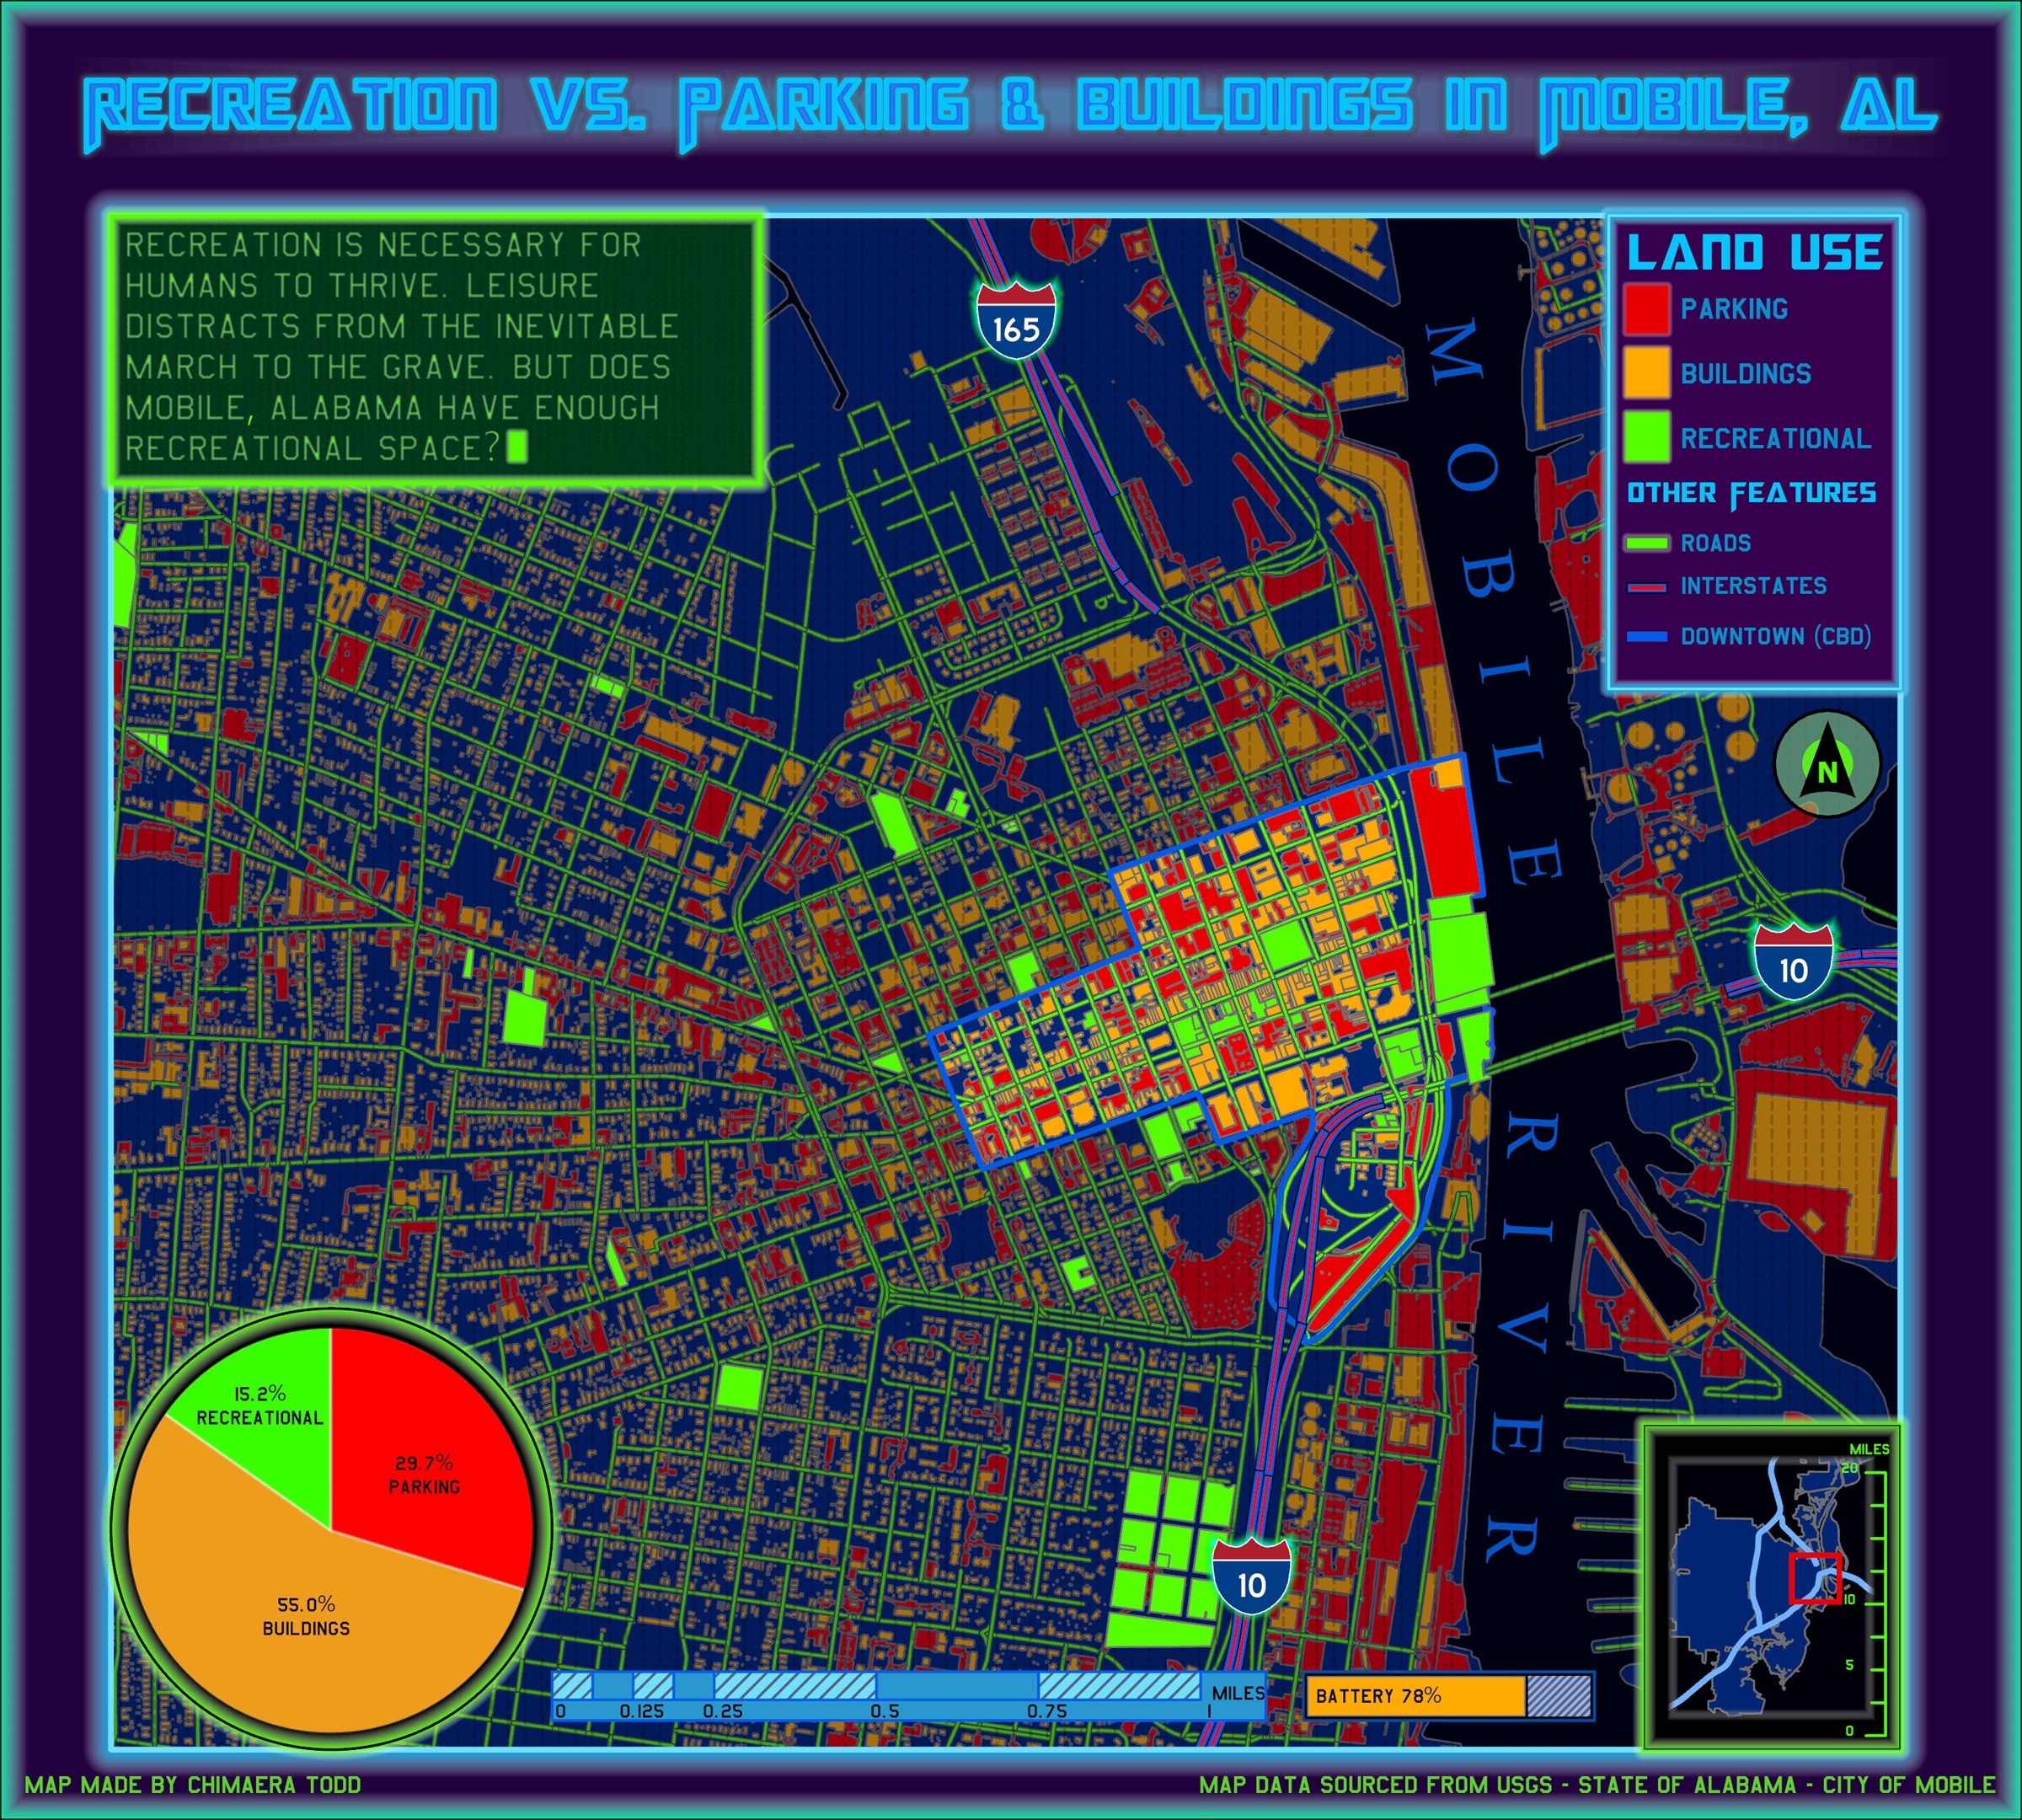
A land use map of Mobile, Alabama that asks whether the city has enough recreational space. Parking, buildings and recreational land are mapped in red, orange and green, with roads, interstates and the downtown business district also shown.
A pie chart on the map breaks down the three mapped land uses: 55.0% buildings, 29.7% parking and 15.2% recreational. The map is styled like a retro computer display, and includes a battery indicator, a locator inset and a scale bar.
| Subject | Mobile, Alabama |
|---|---|
| Made by | Chimaera Todd, Fall 2025 |
| Data | USGS, State of Alabama, City of Mobile |
Skills
| Software | ArcGIS Pro, PCI Geomatica |
|---|---|
| Programming | R, used in coursework with sf, tidyverse, tmap, spdep and terra |
| Remote sensing | Image segmentation and classification, training data collection, accuracy assessment, change analysis, atmospheric correction, orthorectification |
| Spatial analysis | Site suitability, county level data aggregation, slope analysis, distance based selection |
| Field work | GPS data collection with a Trimble Juno unit |
| Communication | Thematic map design and layout, technical report writing |
Education
James Madison University, Harrisonburg, Virginia.
B.S. Geography, May 2026, magna cum laude. Concentrations in Applied Geographic
Information Science and in Environmental Conservation, Sustainability & Development.
Minor in History.
Awarded a Certificate of Academic Research for her work on the Winchester project and in the program as a whole.
Coursework: Cartographic Design · Cartography and Geospatial Visualization · Digital Image Processing and Remote Sensing · Advanced Topics in Remote Sensing · Applications of GIS · Intermediate Geographic Information Science · Programming for Geographic Information Science · Earth Observation and GPS · Field Studies in Geography · Urban Geography · Climatology · Elementary Statistics
Contact
toddcw04@gmail.com
Richmond, Virginia